Unless you are especially lucky or have a super power that allows you to control the minds of others, you probably don’t sell every first time visitor to your site (If you do, we should talk.)
Most modern marketing efforts almost always involve communicating with potential customers in multiple ways. Yet, the majority of tools only capture the last touch point that resulted in a sale. This is misleading and makes it almost impossible to optimize your marketing budget – how do you separate quality leads from dross? If you are using Google Analytics, you don’t have to accept this sad state of affairs any longer.
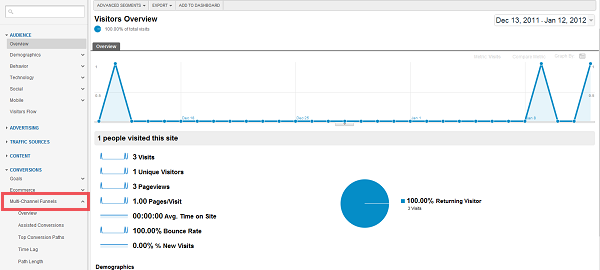
Google has been testing several new Analytics features for the last year, and as of January, turned the features on for all users. The upgraded Google Analytics has a fresh new look and feel, customizable dashboards and my favorite new feature, multi-channel funnels. Multi-channel funnels allow you to see the channels, campaigns and sources customers interacted with during the 30 days prior to conversion and helps you understand:
- how search phrases progress towards conversions
- each traffic source’s role in driving conversions
- each interaction in your sales cycle
Google provides detailed guidance on the new multi-channel funnel functionality in the Analytics support site.
The new multi-channel funnel reports are located in the Conversion reports category.

There are five new reports:
- Overview: A summary report that shows total conversions and assisted conversions, where more than one source contributed to a sale. In addition, the overview report includes a “Conversion Visualizer,” – a multi-colored Venn diagram that helps you see the overlaps in conversions.
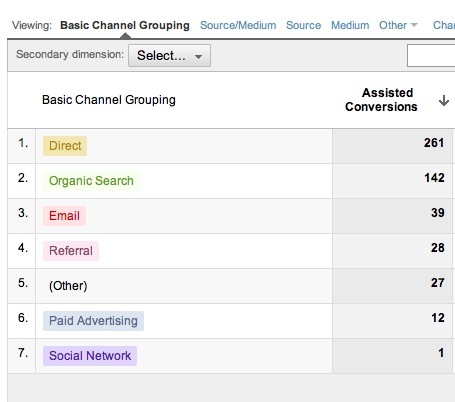
- Assisted Conversions Report: This report helps you understand your conversion path so that you can determine, which channels are most effective.

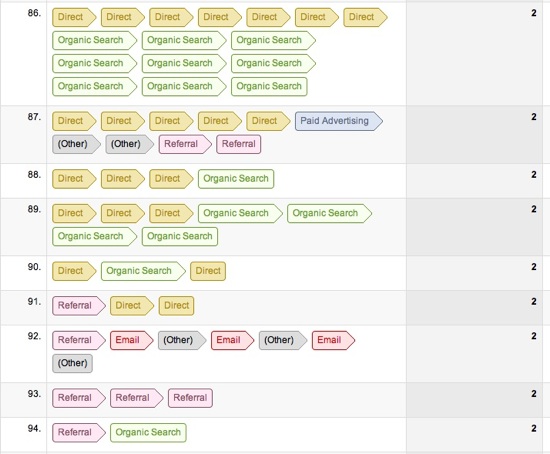
- Top Conversion Paths Report: The Top Conversion Paths report show the sequences of events that led to a conversion. This report is extremely usefully for understanding campaign performance and how various marketing efforts contribute to a sale.

- Time Lag Report: The Time Lag report allows you to see the number of days required to convert a customer. Keep in mind that Google on tracks 30 days of behavior. If a conversion process exceeds 30 days, it is truncated to 30 days.
- Path Length Report: This Path Length report shows how many visits were required to convert a customer.
Unless you have been using a inbound marketing package such as HubSpot or Eloqua you probably haven’t had access to this level of detail before. The new information can be tremendously valuable at helping you answer questions like:
- Should you be spending more (time/effort/money) on social media?
- Is your social media “expert” really helping you get more customers?
- Are your pay per click ads performing influencing organic searches?
- What marketing efforts should you eliminate because they are delivering no value?
In addition to refining what channels you use, the reports can help you refine how you use the channels. For example, if the data shows customers typically begin with email, then search and finally convert from social media, what would happen if they had a social media interaction earlier in the process? If you have not tried the new multi-funnel functionality, I encourage you to do so immediately. If you have tried out the new feature, I would love to know what you think.
